This scenario will give you a guided tour of some relevant features in Zylinc Advanced Statistics. It won't give you exact advice about how to handle a similar scenario in your organization, but it'll provide inspiration about what you can do.

Say that you're a reception team manager, and you want to know about your team's ability to meet your service goal, which is to answer all phone calls within 40 seconds.
Can Zylinc Advanced Statistics help you find out, based on facts rather than gut feeling? Yes. Here's an example:
-
In Zylinc Advanced Statistics, you select REPORTS > ADVANCED REPORTS, and then click Zylinc.
-
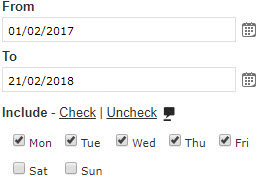
On the Parameters tab's From-To tab, you select the last year, Monday to Friday.
-
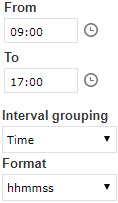
On the Interval tab, you then select your reception's opening hours, which are 09:00 to 17:00.
-
Your reception answers phone inquiries, so on the Report tab you select Voice queues.
When you do that, you get an extra field in which you can specify your service goal, which is 40 seconds.
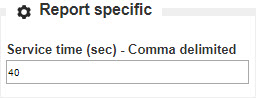
We'll keep things simple in this scenario, but you can specify multiple service goals if you separate them with commas (example: 20, 40, 60). That way, you can get more detailed information for your analysis.
-
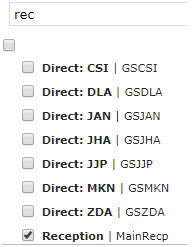
On the Report targets tab, you click the icon to select what you want the report to cover, in your case the Reception queue.
It turns out that your organization has a lot of queues, so you type rec to quickly filter the long list of queues, and then you select Reception.
-
Then you click the Execute report button.
In the following, we'll look at how you analyze the report's data to find out how well your team meets the goal of answering all calls within 40 seconds.
Now that you have the report, you can quickly look at different perspectives of your team's ability to meet the 40-second service goal.
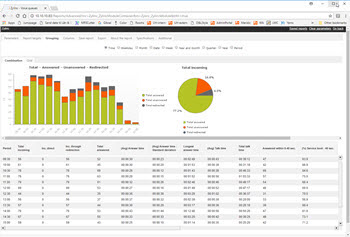
However, the first thing that catches your eye is something else; the fact that 16.8% of calls to your reception during opening hours in the past year weren't answered at all:
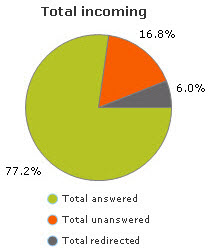
That's potentially a big problem, and definitely something you need to look into later. It's also an example of how Advanced Statistics can help uncover things that you perhaps weren't aware of.
However, for now you concentrate on the calls that your reception did answer. Were they all answered within 40 seconds?
Your report offers several views. The one you look at first is the time view. It has a table that lists your reception's opening hours in 30-minute blocks: from 9:00 until 9:30, from 9:30 until 10:00, etc. That'll tell you if your team has been able to meet the service goal equally well throughout the day:
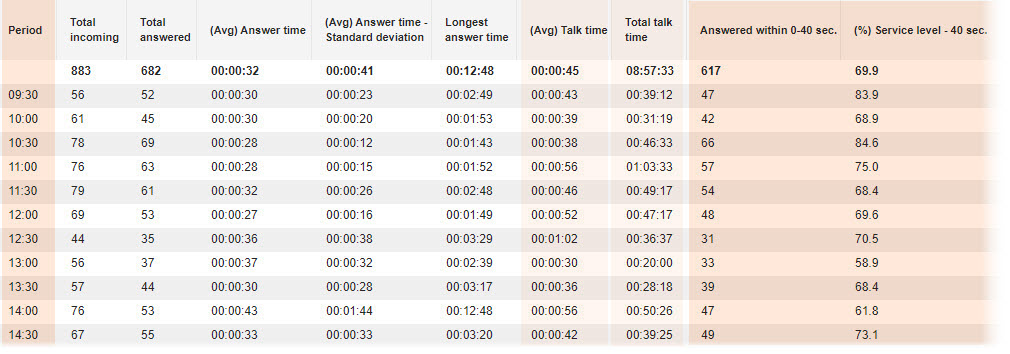
The top row shows your total. During the past year, your reception met the service goal in 69.9% of the cases.
When you look at the 30-minute blocks, you can see that your team performed better in some time blocks than in others. For example, while you performed pretty well between 10:00-10:30 (84.6% of calls answered within service goal), your performance was down to 58.9% between 13:00-13:30.
That's when most people in your organization have their lunch. Perhaps too many of your receptionists have been away for lunch at the same time?
Note that average and total talk time is also significantly lower in the 13:00-13:30 time block. That might further indicate that customers who called your reception around lunchtime didn't get a good experience: They often had to wait longer than 40 seconds before their calls were answered—and when they got through, they were possibly met by a busy receptionist who didn't have much time to deal with the inquiries.
You know from experience that customers who call around lunchtime often have the most complex inquiries, because that's when they have time to talk, so you decide to immediately improve lunchtime staffing in your reception.
The fact that the total figures show that you only answered 69.9% of all calls within the 40-second service goal worries you. However, the total covers data from a whole year. Perhaps you've improved lately?
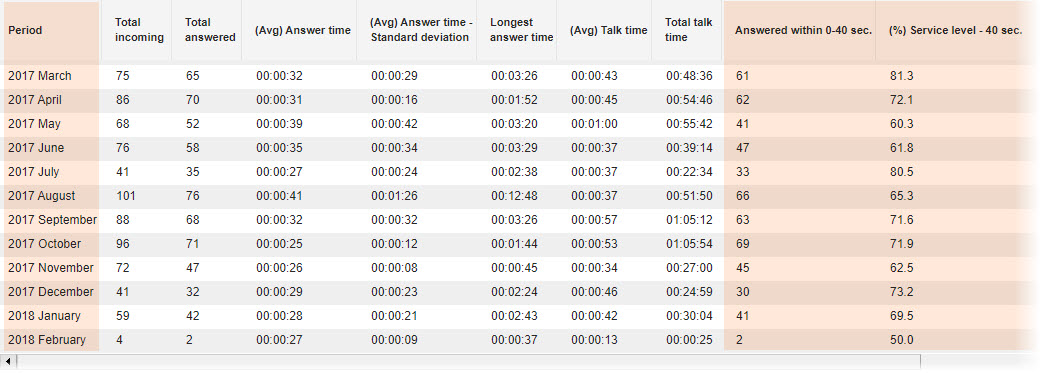
To find out, you switch the report to year and month view.

You can quickly see that your performance in recent months hasn't been better than your earlier performance.
You then ask yourself if a particular day of the week is very busy, and consequently prevents you from reaching your service goal.
To find out, you switch the report to weekday view.
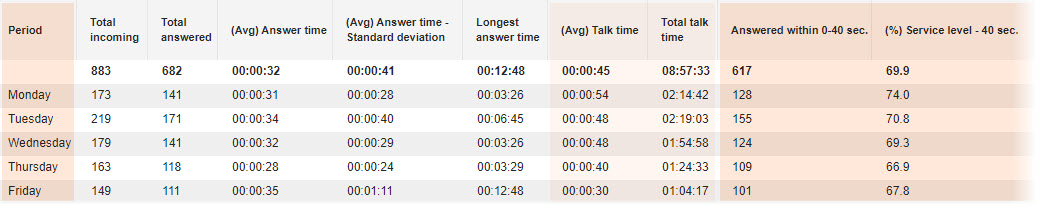
You notice that your ability to meet the service goal was highest on Mondays (74.0%). On Tuesdays, you didn't perform as well as on Mondays, but Tuesday was also the day of the week when you got the most calls.
However, towards the end of the week, when you got fewer calls, your ability to meet the service goal was even lower. On Thursdays, you were down to 66.9%.
You also notice something else: Your talk time went down as the week progressed. On Mondays, you talked with customers for an average of 45 seconds, while on Fridays you only talked for an average of 30 seconds.
Your ability to reach the service goal was highest on the first days of the week. However, those first days of the week were also when you got the most calls, and when you spent the most time on handling calls.
This was an example scenario, and all assumptions in it were made by a fictional character. All organizations are different, and in each case many factors will contribute to the full picture.
In this scenario, the fictional character looked at data based on time of day, month, and weekday. Some things were very evident:
-
The team wasn't very good at meeting their service goal
-
There were also many abandoned calls.
However, many things might have contributed to that. For example, ...
-
Did the team have the same number of staff in their reception throughout the year? Throughout the days of the week? Throughout the hours of the day?
-
Did some receptionists perform better than others?
A little further analysis in Zylinc Advanced Statistics would quickly help answer such questions, for example through a Users by ID report, but knowledge about the organization and its stakeholders is also important to make sure that you interpret the data in the right context:
-
Did the team have a high staff turnover, so that they often needed to train new receptionists before they got up to speed?
-
Did the organization run campaigns or release new products that may have affected the number of calls that they got?
-
Has the customer base changed since the service goal was set?
-
How long ago did the organization set its service goal? Is it still realistic?
-
Does the organization view short talk time a problem or as a sign of efficient customer service?
All those factors, and many more, may have affected the team's ability to meet its service goal. That's why knowledge about the organization and its stakeholders is extremely helpful when you analyze data and make conclusions and recommendations.
This was an example scenario, but if it's made you think about how you can use Zylinc Advanced Statistics for facts-based analysis in your organization, it's been a successful one.
This is help for Zylinc version 6.5. To view Zylinc unified help for other versions, go here.
© 2021 Zylinc A/S • Disclaimer
Zylinc unified help is a UK Technical Communication Awards winner 
Help version: 24 February 2021 14:16:14
Share this topic: